← Back to projects
Software · IIoT
Industrial Energy Monitoring System
Full-stack IIoT solution reading electrical variables from Schneider energy meters via BACnet, storing historical data in MySQL, and presenting it through a real-time web dashboard.
The Problem
The plant had Schneider energy meters installed across different electrical panels, but there was no centralized way to read, store, or visualize that data. Energy consumption tracking was manual, fragmented, and provided no visibility into consumption patterns or anomalies across the facility.
The Solution
I designed and built a complete 3-layer IIoT solution — covering data acquisition, storage, and visualization in a single integrated platform.
Architecture
L1
Acquisition — Python + BACnet/IP
Python service polls Schneider meters over BACnet protocol, reading electrical variables at regular intervals with deadband filtering
L2
Storage — MySQL
All readings persisted in a structured MySQL database — current values, full historical log, and cumulative energy per section
L3
Visualization — PHP + HTML + JS
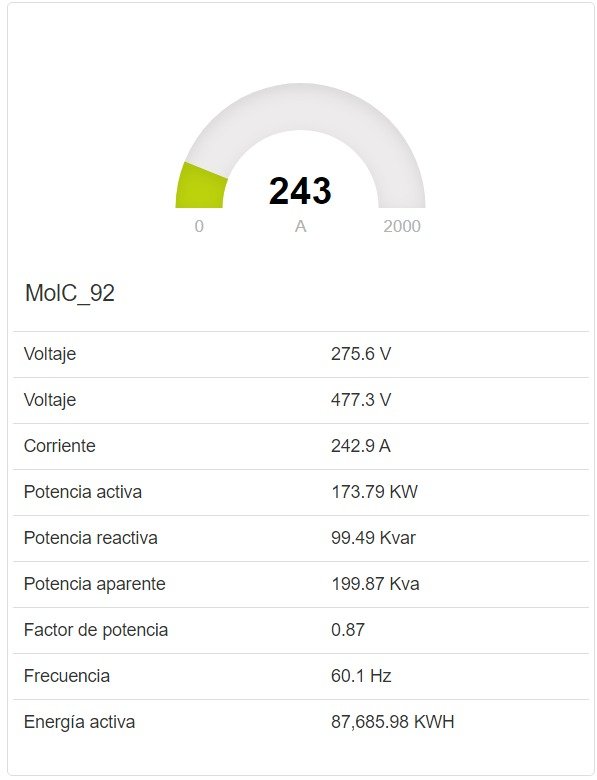
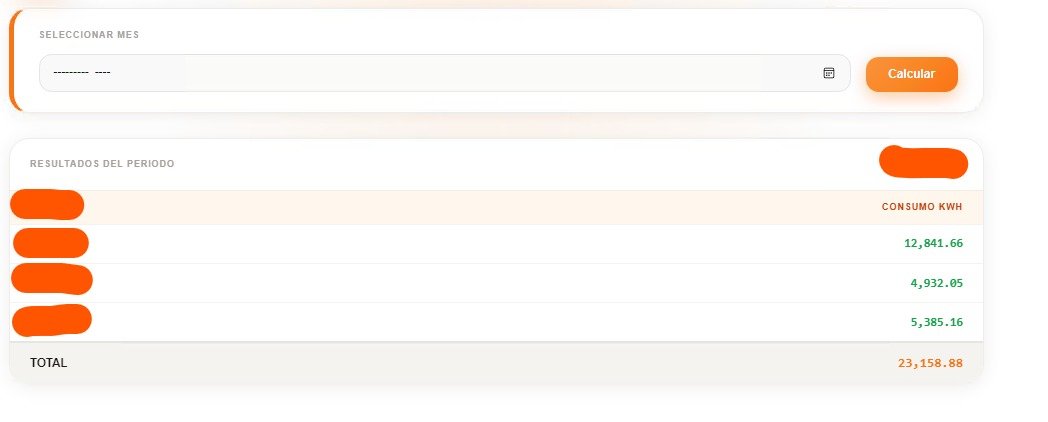
Web dashboard queries the database and presents live readings, consumption summaries, and historical trends
Monitored Variables
- Voltage — line-to-neutral and line-to-line (V)
- Current (A)
- Active power (kW), Reactive power (kVAR), Apparent power (kVA)
- Power factor
- Frequency (Hz)
- Active energy consumption (kWh) — cumulative and by period
Results
- Centralized energy visibility across the entire facility
- Historical data available for energy efficiency analysis
- Basis for detecting abnormal consumption patterns
- Scalable architecture — new meters added without code changes
- Open source Python script published on GitHub